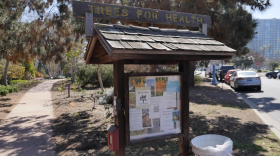
A concrete barrier separates the bike lane from car traffic on Fifth Avenue in Hillcrest. Jeremy Bloom, CEO of the advocacy group Circulate San Diego, said it’s a good example of infrastructure improvements that can save lives.
“It’s really protected for cyclists,” he said. “They feel safe.”
That stops once cyclists turn left onto Washington Street. Bloom pointed to where the bike lane comes to an end partway down the block between Third and Fourth Avenues.
“It just turns, and it ends, and you’re literally put right in the center of traffic,” he said.

Jennifer Heffernan bikes from Hillcrest to Kensington most days for work. She said that happens throughout her regular bike routes, especially near freeway entrances.
“The bike lanes disappear, and it’s very frightening to try and get across,” she said.
The city of San Diego is inviting the community to give feedback on bike infrastructure online through Sept. 10. They say they’ll use them to shape the new Bicycle Master Plan, which helps them prioritize future infrastructure projects as they seek funding.
There’s an interactive map where users can note what works well and what could be improved. The map has nearly 500 contributions so far.
![An animation showing how the city of San Diego BMPU Interactive Feedback Map works, Aug. 20, 2024. To submit feedback, visit the <a href="https://fp.mysocialpinpoint.com/sd-bmpu/feedback-map" target="_blank" link-data="{"cms.site.owner":{"_ref":"00000179-8a1f-d704-a9f9-fa5f6dab0000","_type":"ae3387cc-b875-31b7-b82d-63fd8d758c20"},"cms.content.publishDate":1724201047144,"cms.content.publishUser":{"_ref":"00000179-8a39-de15-adfb-af79b7fe0000","_type":"6aa69ae1-35be-30dc-87e9-410da9e1cdcc"},"cms.content.updateDate":1724201047144,"cms.content.updateUser":{"_ref":"00000179-8a39-de15-adfb-af79b7fe0000","_type":"6aa69ae1-35be-30dc-87e9-410da9e1cdcc"},"cms.directory.paths":[],"link":{"attributes":[],"cms.directory.paths":[],"linkText":"city of San Diego interactive map ","target":"NEW","attachSourceUrl":false,"url":"https://fp.mysocialpinpoint.com/sd-bmpu/feedback-map","theme.kpbs-theme-falcon.:core:link:Link.hbs._template":null,"_id":"00000191-7264-d9b5-abbb-fbe404e00001","_type":"ff658216-e70f-39d0-b660-bdfe57a5599a"},"theme.kpbs-theme-falcon.:core:link:Link.hbs._template":null,"_id":"00000191-7264-d9b5-abbb-fbe404e00000","_type":"809caec9-30e2-3666-8b71-b32ddbffc288"}">city of San Diego interactive map</a>.](https://cdn.kpbs.org/dims4/default/92ac540/2147483647/strip/true/crop/951x586+9+0/resize/880x542!/quality/90/?url=http%3A%2F%2Fkpbs-brightspot.s3.us-west-2.amazonaws.com%2F7b%2F52%2F62ea8d2e44c1896c346664310dcd%2Fbike-feedback-map.gif)
There’s also a trip map, where the city is asking cyclists to indicate where they usually ride. And there’s a survey asking cyclists to rank the types of infrastructure and policies they’d like to see most.
Bloom said it’s important for cyclists of all ages and abilities to give their input.
“The occasional cyclists, they’re the ones that we’re trying to build a lot of this infrastructure for,” he said. “If you want to have your kid bike to school, you want to make sure they’re on a protected bike lane and have good intersections for them to cross.”
The two maps and the survey are open until Sept. 10.
Funding for the study comes from the Caltrans Sustainable Transportation Planning Grant program. The Bicycle Master Plan was last updated in 2013.


