Taxable sales in the San Diego region were down nearly $2.3 billion in March, according to a San Diego Association of Governments report released Thursday.
The new SANDAG report, "COVID-19 Impact on the San Diego Regional Economy: Consumer Spending," estimates the region's taxable sales went from an average of $5.3 billion each month prior to March 15, down to nearly $3 billion in April. That represents a decrease of about 44% or roughly $2.3 billion.
"Our Chief Economist Ray Major and his team are working around the clock to support local elected officials and other decision-makers with relevant data and analysis to manage this pandemic," said SANDAG Executive Director Hasan Ikhrata. "These reports have been essential tools to determine next steps in the region's economic road to recovery."
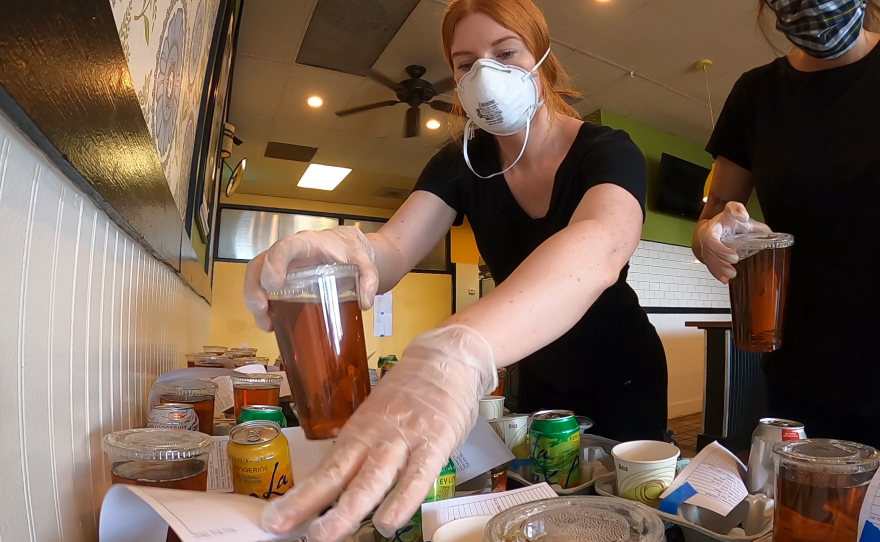
The report estimates the largest losses in taxable sales are to apparel stores, down 83%, and restaurants, down 67%.
Businesses that remained open and fared well during this time frame were food markets and big-box retail stores such as Costco, Target and Walmart.
"It is interesting to learn that grocery stores and pharmacy sales are actually down by 10%, while home improvement sales have spiked," said Major. "We can assume that during the pandemic, people had more time to work on outdoor landscaping, gardens and other home beautification projects. Plant seed companies also saw increases — nearly four times their average sales."
The outlook for the home improvement industry remains strong as consumers continue to invest in upgrading their homes. The report shows a return to baseline for home centers and home and garden businesses starting the week of April 12, likely due to stimulus check distribution.
Online retailers such as Amazon also continue to increase market share, as consumer spending increased 35%, demonstrating a potential reinvention of eCommerce and a reshaping of retail in the future. This spike resulted in an announcement by Amazon to hire 175,000 new employees during the pandemic.
Information for this SANDAG report was generated by research and data collection conducted since the start of the stay-at-home order in mid-March. Foot traffic and travel patterns were captured by cell phone provider data via SafeGraph and Google Mobility; samples of debit card transaction data were collected at a merchant and categorical level to analyze consumer spending; and U.S. Census Bureau advance estimates of U.S. retail and food services sales for April 2020 were used.


